Fintech Analytics Platform
Advanced financial data visualization SaaS platform for institutional investors, featuring interactive D3.js charts and AI-driven insights.
Client
NexaFin
Year
2024
Category
SaaS Dashboard
10M+
Data Points Rendered
<200ms
Chart Render Time
12
Enterprise Clients
01Project Overview
NexaFin is a B2B SaaS product targeted at fund managers and institutional investors who need to analyze large portfolios in real-time. The platform aggregates data from multiple financial APIs and presents it through highly interactive charts, customizable widgets, and AI-generated weekly summaries. We designed and built the entire front-end product, collaborating closely with NexaFin's back-end team on the API schema.
02The Challenge
Existing tools like Bloomberg terminals are powerful but expensive and have notoriously bad UX. NexaFin wanted to offer 80% of the functionality at a fraction of the cost with a modern, intuitive interface.
03Our Solution
We built a configurable dashboard where users can arrange, resize, and customize their data widgets. All charts are rendered with D3.js for maximum performance and interactivity. A dark-mode-first design was chosen to align with the professional finance aesthetic.
04Key Results
10M+
Data Points Rendered
<200ms
Chart Render Time
12
Enterprise Clients
Project Info
Tech Stack
Deliverables
- Configurable Dashboard
- 50+ Interactive Chart Types
- Multi-portfolio Analysis
- AI Insight Summaries
- Dark Mode UI
- Export to PDF/Excel
More Projects
View All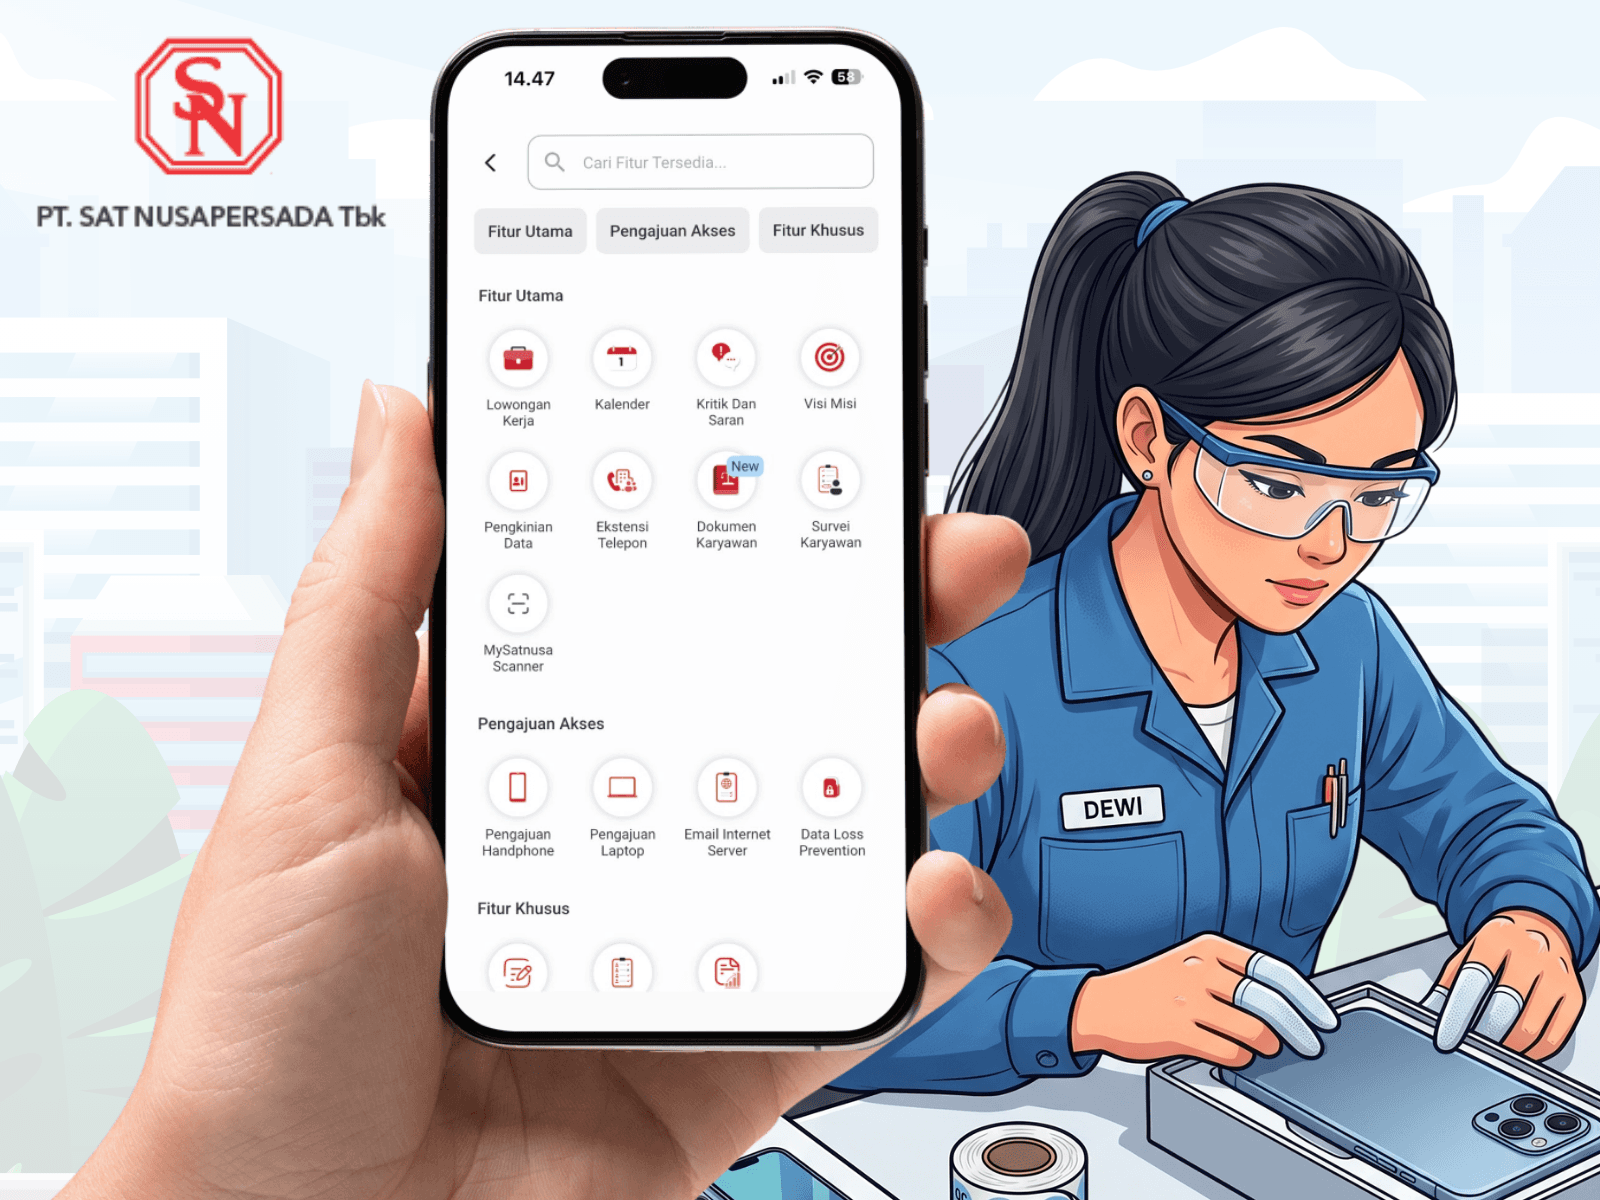
MySatnusa Enterprise
A comprehensive enterprise resource planning (ERP) dashboard designed to streamline inventory, HR, and financial reporting across multiple branches in real-time.

Warriors E-commerce
A high-conversion e-commerce storefront for a premium athletic gear brand, featuring smooth animations and a streamlined checkout flow.

Turun Mobility App
Sleek and intuitive ride-sharing app interface designed for frictionless onboarding and a premium user experience.